Indoor Gardening: Understanding the Basics of Hydroponics and LED Technology
Introduction to Indoor Gardening: Understanding the Basics of Hydroponics and LED Technology
Welcome to the verdant world of indoor gardening, where the marriage of hydroponics and LED grow lights has revolutionized the cultivation of plants ranging from delicate microgreens to robust marijuana. This comprehensive guide embarks on a journey “From Seedling to Harvest,” exploring the synergistic potential of combining advanced LED lighting with the precision of hydroponic systems. Whether you’re a novice with a newfound green thumb or a seasoned grower aiming to optimize your indoor garden, this article will illuminate the path to maximizing growth, flavor, and yields.
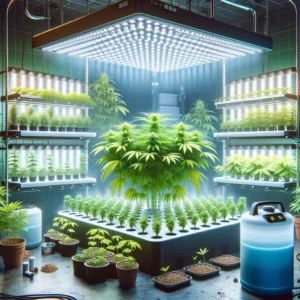
Embarking on an indoor gardening adventure allows cultivators to transcend the limitations of seasons and climate, offering the freedom to produce fresh and organic produce year-round. The cornerstone of this controlled environment agriculture is the hydroponic system – a soilless growing method that utilizes nutrient-rich water solutions to deliver nourishment directly to plant roots. When paired with the tailored light spectra provided by LED grow lights, these soilless wonders are empowered to flourish.
This synergy is not just about growth; it’s about sustainability and efficiency. LED grow lights consume less energy and emit less heat compared to traditional lighting systems, making them an eco-friendly choice for the environmentally conscious grower. Their longevity and customizable spectrum are particularly beneficial for plants like microgreens, which require specific light conditions, and marijuana, which demands varying light during its growth and flowering stages.
As we delve into the nuances of indoor gardening, we’ll cover every critical phase – from the precise care needed during the seedling stage to the triumphant moment of harvest. For those looking to specialize, we’ll dive deep into the art and science of nurturing microgreens and explore the intricacies of cultivating marijuana indoors. We’ll discuss how to tweak your LED lighting and hydroponic setup to suit each plant’s unique needs, ensuring that your garden is not just surviving, but thriving.
So, prepare your gardening gloves and let your curiosity bloom as we navigate through the lush landscape of indoor gardening. By the end of this guide, you’ll be equipped with the knowledge to harness the power of LED grow lights and hydroponics, transforming your indoor space into a haven of horticultural excellence.
Seedling Stage: Setting the Stage for Success with LED Grow Lights
The seedling stage is a plant’s first introduction to the world, and in the realm of indoor gardening, it marks the beginning of an intricate dance with light and water. Seedlings are delicate, requiring a gentle touch and the right conditions to unfurl their first leaves confidently. LED grow lights play a crucial role here, offering a spectrum of light that mimics the sun’s nurturing embrace, but with a precision that only technology can provide.
Understanding the Requirements of Seedlings
Seedlings thrive under a blue-rich light, which LED technology can finely tune. This spectrum encourages strong root development and robust early growth, characteristics that are vital for the later stages of a plant’s life. The controllable nature of LED lights allows growers to create a bespoke environment that can accelerate the seedling’s growth without overwhelming it with heat or intensity.
Setting Up Your LED Grow Lights
The setup for seedlings doesn’t require the full intensity of light that mature plants might. Position your LED lights higher above the seedlings, or use a dimmer to reduce the intensity. This mimics the softer sunlight of early spring, providing your young plants with a comfortable intensity of light.
Monitoring and Adjusting Light Exposure
As the seedlings grow, they’ll need more light. Pay attention to their development and gradually increase the intensity or lower the lights to maintain an optimal distance. This progressive approach helps prevent issues such as legginess, where a plant stretches towards the light source, becoming weak and spindly.
Watering Wisely in Hydroponic Systems
In hydroponics, the absence of soil means that water plays an even more vital role. Seedlings need consistent moisture but are also prone to damping-off and other water-related diseases. Use a hydroponic system to deliver water directly to the roots in a controlled manner, ensuring that your seedlings receive the hydration they need without the risk of overwatering.
Transitioning to the Vegetative Stage
When the seedlings have established a solid root system and are sporting several sets of true leaves, they’re ready for the next phase. This transition is crucial—move them to a more intense light and begin introducing nutrients at the strength appropriate for the vegetative stage.
With these careful considerations, your seedlings will have the best possible start in life, setting them up for a successful journey through the vegetative stage and beyond. Every microgreen and marijuana plant that begins strong stands a better chance of yielding a bountiful harvest, rich in both flavor and potency.
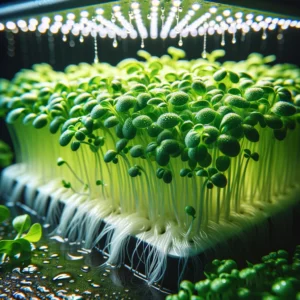
Microgreens Mastery: Tailoring Light Spectrums for Optimal Microgreen Growth
Microgreens, the young seedlings of vegetables and herbs, have surged in popularity due to their nutritional density and the burst of flavor they add to a variety of dishes. Their cultivation under LED grow lights in a hydroponic setup represents a pinnacle of urban agricultural technology, allowing for rapid growth cycles and year-round production. Here’s how to master the growth of microgreens using tailored light spectrums to achieve optimal results.
Selecting the Right LED Spectrum
The secret to lush, vibrant microgreens lies in the spectrum of light they are exposed to. Different species of microgreens respond best to specific light spectra. Generally, a full spectrum LED light that covers all the colors is ideal, but with an emphasis on the blue and red parts of the spectrum. Blue light encourages compact, bushy growth, essential for microgreens, while red light stimulates leaf development and growth rate.
Adjusting Light Intensity and Duration
Microgreens don’t require as much light as mature plants. An intensity of 100 to 200 µmol/m²/s is usually sufficient, and this can be easily achieved with LED lights. The duration of light exposure should mimic the natural day cycle, with 14 to 16 hours of light per day being the sweet spot for most microgreen varieties.
Monitoring Growth and Tweaking Conditions
Observing your microgreens’ growth can give you insights into their light needs. If they appear elongated and pale, they might require more light or a closer light source. Conversely, if the leaves are small and the stem is thick, the light may be too intense. Adjust your LED setup accordingly to maintain the perfect balance for robust growth.
Harvesting at the Right Time
Microgreens are usually ready to harvest within 1 to 3 weeks after germination when they have developed their first true leaves. Use a sharp knife or scissors to cut them just above the soil line or the hydroponic grow medium. Harvesting at the right time ensures the highest nutritional value and the best flavor.
Post-Harvest Handling
After harvesting, microgreens can be rinsed and dried gently. They should be consumed shortly after harvesting to take advantage of their freshness. Alternatively, they can be stored in a refrigerator for a few days, ensuring that they remain crisp and tasty until they’re ready to be served.
By mastering the specific requirements of microgreen cultivation under LED lights, growers can ensure a constant supply of these nutritious greens. Each harvest promises a bounty of flavor and health benefits, showcasing the remarkable advantages of modern indoor gardening techniques.
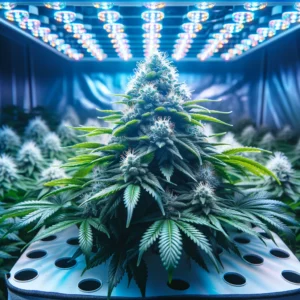
Flowering and Fruiting: Dialing in LED and Hydroponic Systems for Marijuana Cultivation
The flowering stage is a critical period in the life cycle of a marijuana plant, marking the transition from vegetative growth to the production of the sought-after buds. This phase demands a nuanced understanding of the plant’s needs, particularly in terms of light and nutrients, to maximize yield and potency. Here’s how to fine-tune your LED grow lights and hydroponic system to support your marijuana plants through their flowering stage.
Transitioning to Flowering with LED Lights
As marijuana plants enter the flowering stage, their light requirements change. Switching the light schedule to 12 hours of light and 12 hours of darkness mimics the natural photoperiod of autumn and triggers flowering. LED lights should be adjusted to provide a spectrum with more red wavelengths, which promotes bud development. This shift not only signals the plants to flower but also supports the formation of dense, resinous buds.
Optimizing Nutrient Delivery in Hydroponics
The nutrient needs of marijuana plants also evolve during flowering. The focus shifts towards phosphorus and potassium to support bud formation, with a reduced need for nitrogen. Using a hydroponic system allows for precise control over nutrient concentrations and pH levels, ensuring that plants receive the perfect balance to thrive. Adjusting your feeding schedule and solution strength according to the flowering stage’s progression is key to avoiding nutrient burn or deficiency.
Monitoring Humidity and Temperature
Maintaining optimal environmental conditions is crucial during the flowering stage. High humidity can lead to mold and mildew issues, particularly in dense buds. Aim to keep humidity levels around 40-50% and temperatures between 68-77°F (20-25°C) during the light period. LED lights generate less heat than traditional grow lights, making temperature control easier and reducing the risk of heat stress on your plants.
Enhancing Bud Quality with LED Spectrum Tuning
LED grow lights offer the unique advantage of spectrum tuning, allowing growers to experiment with light recipes that can enhance the quality of marijuana buds. Some growers find that introducing ultraviolet (UV) light for short periods can increase THC content and resin production, adding an extra layer to the complexity and potency of the final product.
Harvesting at Peak Potency
The right time to harvest depends on the strain and the desired effects. Monitoring the trichomes on the buds can provide clues; clear trichomes indicate it’s too early, milky white trichomes suggest peak THC levels, and amber trichomes signal a higher CBD content. Careful timing ensures that you harvest your marijuana at its peak potency, capturing the full spectrum of cannabinoids and terpenes.
By meticulously managing the LED lighting and hydroponic conditions during the flowering stage, growers can significantly influence the yield and quality of their marijuana harvest. This detailed approach to indoor cultivation highlights th symbiotic relationship between technology and nature, leading to unparalleled results in the world of cannabis production.
Conclusion: The Future of Indoor Gardening with LED and Hydroponics
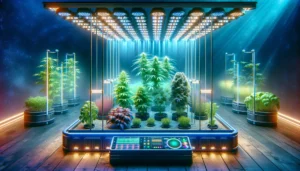
The journey from seedling to harvest in the realm of indoor gardening is a testament to the incredible advancements in LED grow light technology and hydroponic cultivation methods. As we’ve explored, the careful integration of these systems offers a sustainable, efficient, and highly effective approach to growing microgreens and marijuana indoors. Whether for personal use or commercial production, the synergy between LED lighting and hydroponics paves the way for year-round cultivation, irrespective of external climatic conditions.
This guide has illuminated the key stages of plant growth, emphasizing the tailored care that microgreens and marijuana require to flourish. From the delicate seedling stage to the bountiful harvest, the precision offered by LED grow lights and hydroponic systems ensures that every plant reaches its full potential. The ability to control environmental factors such as light spectrum, intensity, and nutrient delivery allows growers to optimize their indoor gardens for both yield and quality.
As we look to the future, the potential for innovation in indoor gardening remains boundless. Advances in LED technology and hydroponic research will continue to refine our understanding and capabilities, promising even greater efficiency and productivity. For enthusiasts and commercial growers alike, the evolution of these technologies represents an exciting frontier in the pursuit of sustainable agriculture and horticulture.
In embracing these modern cultivation techniques, we not only enhance our ability to produce fresh, nutritious, and potent plants but also contribute to a more sustainable and responsible approach to plant cultivation. Indoor gardening, powered by LED and hydroponics, stands as a beacon of progress, offering a glimpse into the future of agriculture that is within our reach.